
Introduction
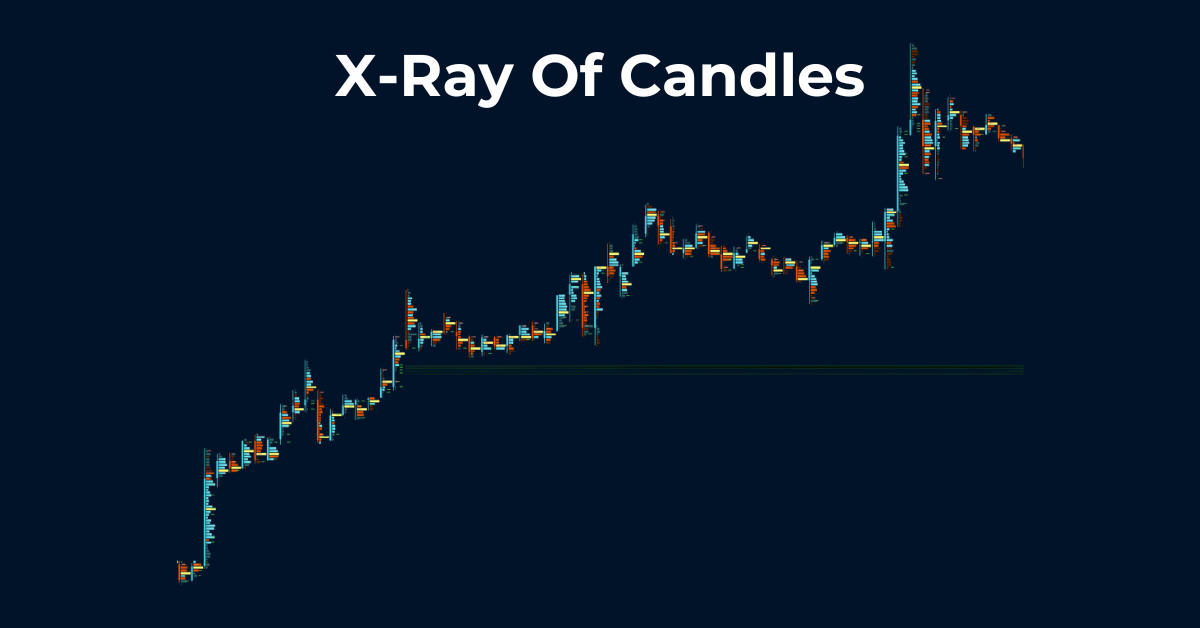
A footprint chart is like a microscope for market structure. It shows not just where price moved — but how it moved.
Understanding Footprints
Each candle contains data on bid vs ask volume, showing aggressive buyers and sellers. This lets you identify imbalances, absorptions, and delta shifts that drive reversals.
Key Concepts
- Bid/Ask Imbalance: When one side dominates, showing strength.
- Cumulative Delta: Tracks net buying/selling pressure over time.
- Absorption: When price stays still but volume builds — a clue of strong hands entering.
Why Traders Use It
With footprint charts, you stop guessing. You see orderflow confirmation at precise zones — ideal for entries, reversals, and scalps.
Final Thoughts
Tools like Exocharts visualize this data beautifully. Join Spartans Clan to learn how pros interpret footprints live.